Measuring a sinking city
Satellite radar interferometry turns millimetres of ground movement into maps — and removed any room for doubt about the scale of urban subsidence.

What a fringe pattern looks like at street level, in a district that has dropped unevenly.
How a radar satellite becomes a ruler
When a synthetic-aperture radar satellite passes over a city, it bounces microwave pulses off the ground and records the return time with extraordinary precision. Pass over the same patch of ground on two separate dates and compare the phase of the returning signal, and any shift in the distance between satellite and surface becomes visible as interference fringes — a technique called interferometric synthetic-aperture radar, or InSAR. A single fringe typically represents a displacement of around 28 millimetres. Stack dozens of image pairs and apply persistent-scatterer methods, which track stable reflectors such as building corners and road surfaces across a long time series, and the resolution improves further: ground movement of a few millimetres per year becomes measurable across an entire metropolitan area simultaneously.
No borehole network, however dense, achieves that spatial coverage. Traditional levelling surveys measure points along roads; GPS stations measure only where instruments are installed. InSAR fills the gaps without a single field crew, and it does so retroactively — archived satellite data from missions such as the European Space Agency's Sentinel-1 or the earlier ERS satellites can be reprocessed to reconstruct subsidence histories stretching back to the 1990s.
What the maps revealed
The results for heavily pumped cities have been unambiguous. NASA Jet Propulsion Laboratory researchers applying InSAR to Jakarta found parts of the city's north coast sinking at more than 25 centimetres per year during peak pumping periods — rates that make engineering responses a race against the calendar. Mexico City's former lake-bed sediments show differential subsidence across the metropolitan area: some districts have dropped by nine metres or more over the twentieth century, and the process continues unevenly, which is why drainage gradients across the city have reversed in places, sending wastewater uphill relative to its original design. The United States Geological Survey has applied similar methods to monitor compaction above over-pumped basins in California's San Joaquin Valley, where subsidence exceeding a foot per year was recorded in the mid-2010s.
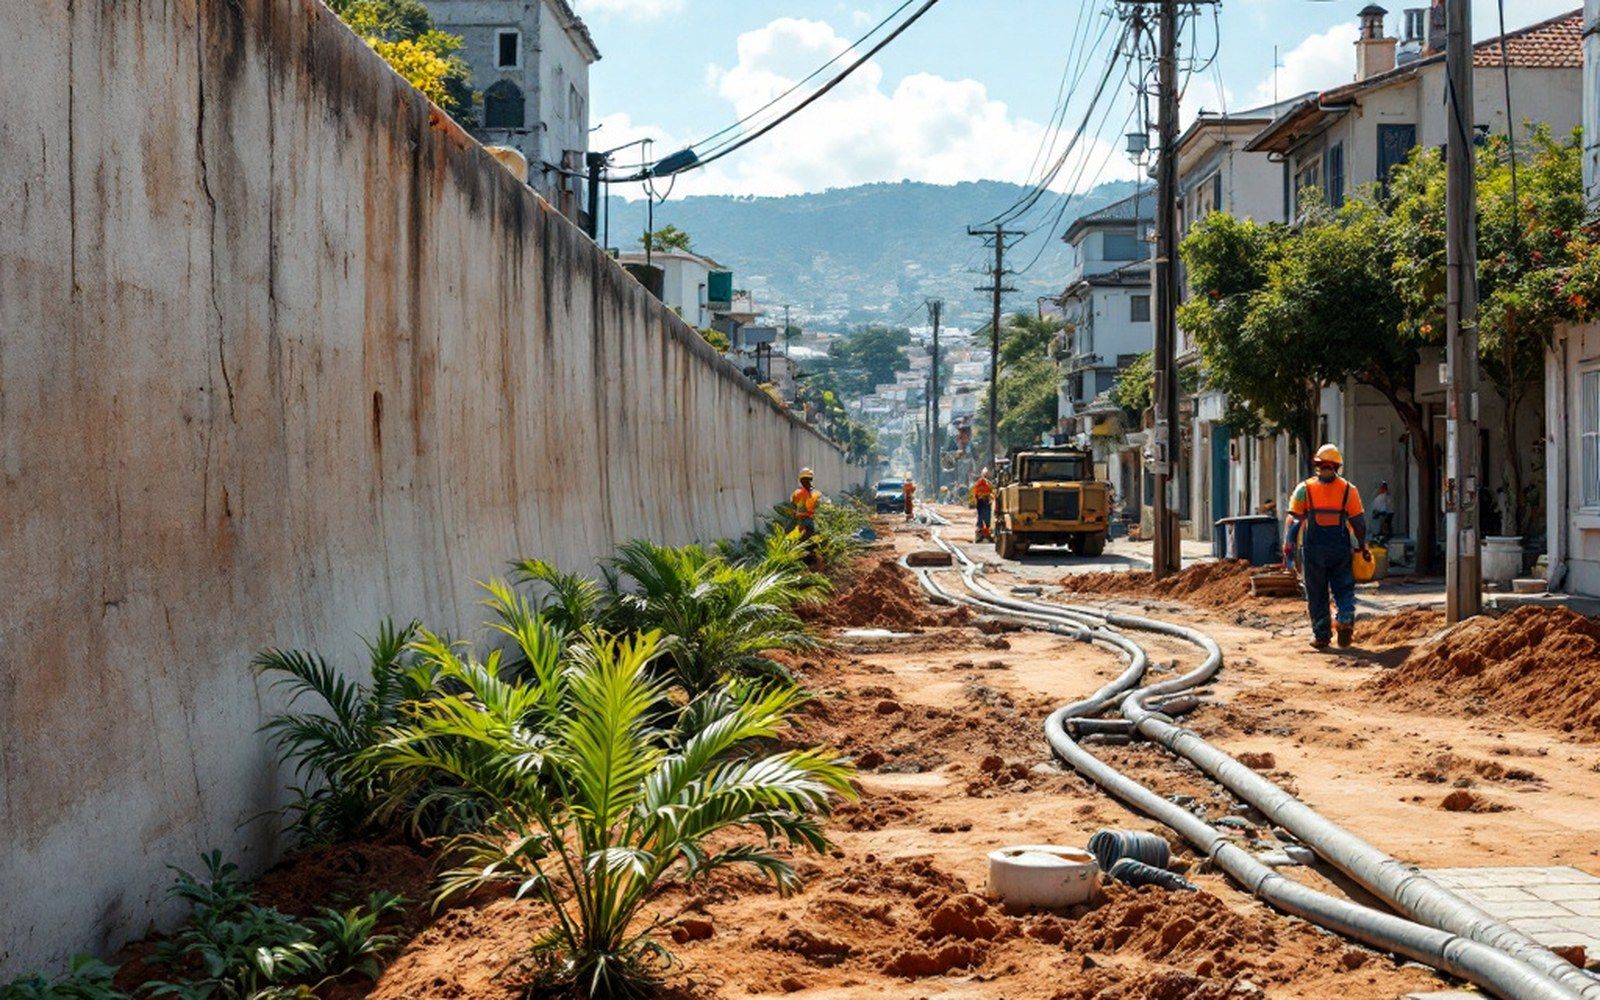
North Jakarta: rates that make an engineering response a race against the calendar.
The policy value of the technique is that it makes denial arithmetically difficult. When a government agency or a water utility disputes the rate of extraction or questions whether pumping is causing observed damage to buildings and infrastructure, a satellite archive carrying spatially continuous, independently verifiable displacement data changes the character of the argument. The numbers come from orbital mechanics and the speed of light, not from a contested monitoring well. That does not resolve questions of legal responsibility or the cost of remediation — it only, but importantly, settles what is physically happening and at what rate.