How far the water has fallen, county by county
The decline is not uniform: some counties have lost most of their saturated thickness and others almost none, and the map of that is the real story.
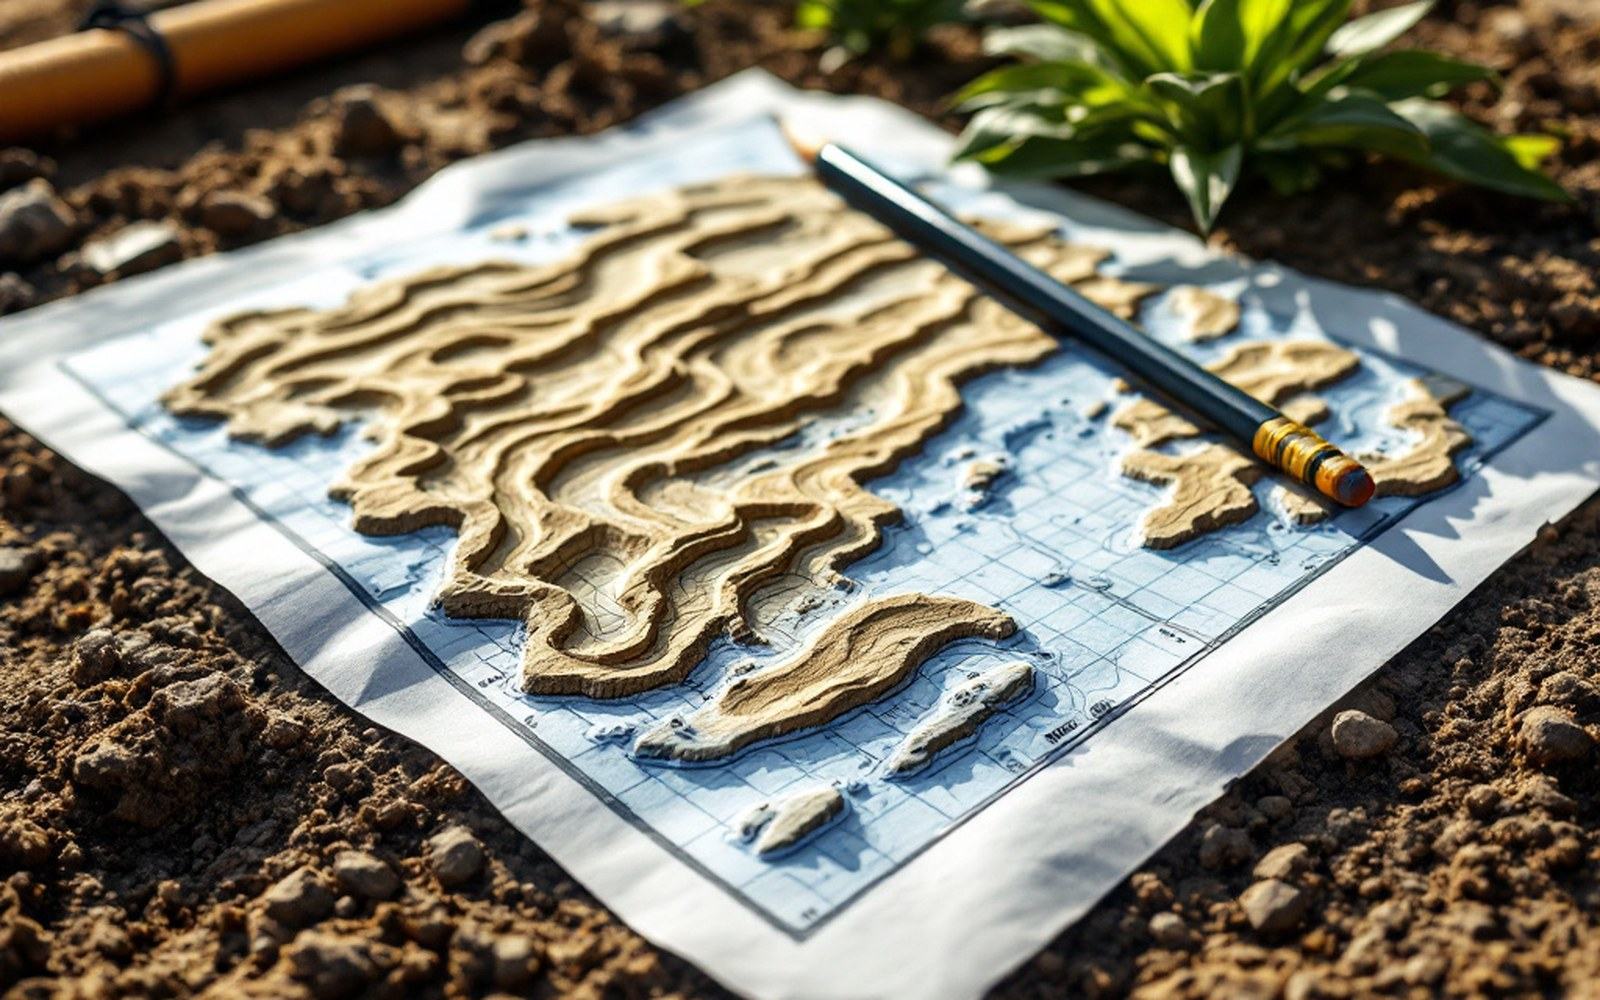
Every contour on the map resolves to one of these: a cased observation well and somebody's January reading.
The map is not uniform
The High Plains aquifer does not drain evenly. That is the first and most important fact about its decline, and it is one that aggregated numbers — average saturated thickness across the whole formation, total cubic miles removed — consistently obscure. The aquifer stretches from South Dakota to the Texas Panhandle, roughly 174,000 square miles of porous sand and gravel sitting atop a clay confining layer. Across that distance, the water table has done very different things, and the county-by-county record kept by the United States Geological Survey and the Kansas Geological Survey makes the variation visible.
In the north — in Nebraska's Sand Hills — recharge from surface infiltration is relatively high, the overlying soils are sandy, and pumping has been lighter. Saturated thickness in some Nebraska counties remains above 200 feet and in places reaches toward 300. Water levels there have declined modestly or, in some years, recovered slightly. The formation beneath that part of the plains is thick enough, and the recharge just sufficient, that the arithmetic has not yet become drastic.
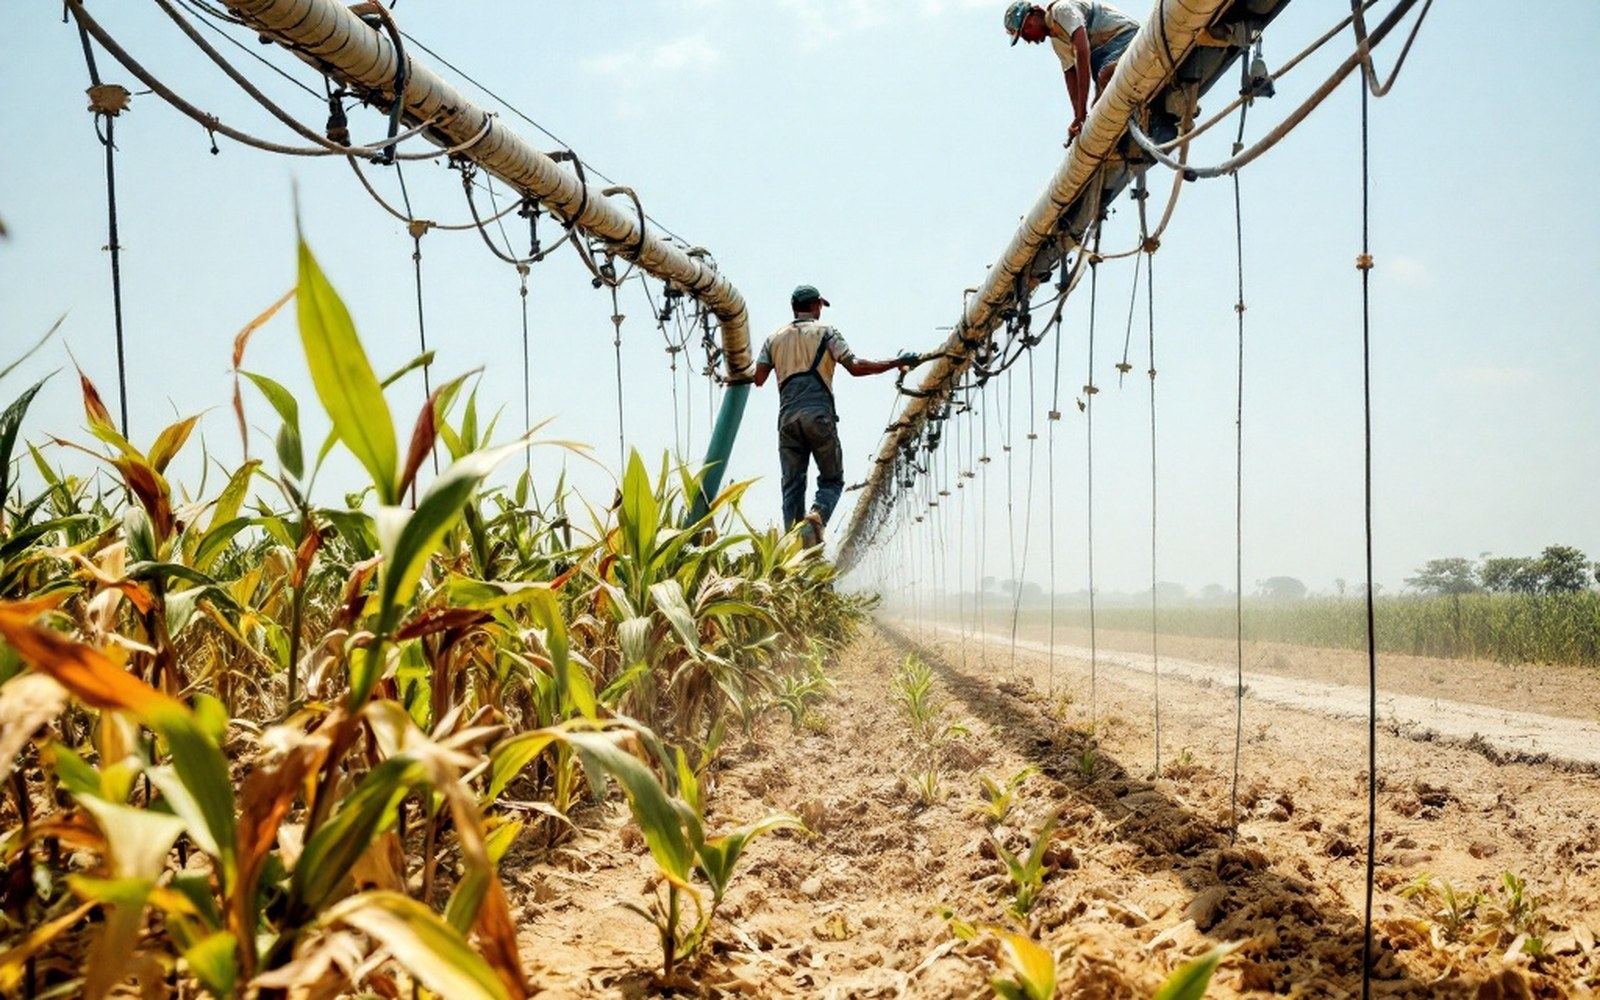
Below roughly thirty feet of saturated thickness the pivot comes off, and the land returns to what rain will carry.
Move south into southwestern Kansas and the numbers flip. In Haskell County, Kansas — one of the most intensively studied patches of the High Plains — saturated thickness has dropped by more than half since pre-development levels, measured across decades of monitoring wells. Grant, Stanton, and Morton counties show similar trajectories: the original water column, in places over a hundred feet deep, now measures in tens of feet across wide areas. When saturated thickness falls below roughly thirty feet, most irrigation wells cannot draw economically — the pump intake has to sit above the aquifer floor, and the column of water left to draw from is not enough to sustain crop-season demand. Below about fifteen feet, the well is effectively done.
The mechanics behind the variation
The difference between Nebraska and southwest Kansas is not mainly about geology in the sense of rock type — it is mostly about original saturated thickness, recharge rate, and how hard the land above has been pumped. The original thickness matters because it sets the ceiling; a county that started with 300 feet can lose 100 feet and remain agricultural. A county that started with 80 feet and has lost 60 has a different remaining resource entirely, even though the absolute decline might be smaller.
Recharge is the other lever. The USGS estimates average natural recharge across the aquifer at roughly half an inch to one inch of water per year in most areas, compared to annual withdrawals that have historically run two feet or more per year in the intensive irrigation zones of Kansas, Oklahoma, and the Texas Panhandle. In the Texas Panhandle counties — Deaf Smith, Castro, Swisher — declines since the 1950s exceed 150 feet in some measurement points. The Texas Water Development Board and the USGS have tracked these numbers through networks of observation wells, and the record is consistent: the deficit between extraction and recharge in those southern counties has been running for sixty-plus years without meaningful interruption.
What makes this geography consequential is that it is not reversible on any human planning horizon. The water now missing from Haskell County or Deaf Smith County fell as precipitation, percolated down through soil, and accumulated over thousands of years — the recharge timescales involved are measured in millennia in the deeper parts of the formation. Stopping all pumping tomorrow would not refill those counties within a century. The resource is not being managed down; it is being spent.
Reading the numbers county by county
The Kansas Geological Survey publishes annual water-level maps for Kansas counties, derived from measurements taken each January — before the irrigation season begins — so that seasonal pumping does not contaminate the baseline. The monitoring network covers hundreds of wells, each identified by legal description, measured by a steel tape or electronic transducer, and compiled into a record that now runs back in some wells to the 1940s. The result is not a model or a satellite estimate; it is a direct physical measurement of where the water surface stands in that county in that year.

What those maps show, over decades, is an expanding core of severe depletion centered on the Kansas-Oklahoma-Texas tri-state area, surrounded by a zone of moderate decline across central Kansas, with the northern tier holding comparatively well. The depletion core is not shrinking. In some counties it has stabilized, not because recharge has caught up but because the irrigated acreage has contracted — there is less water to take because the wells that would take it are no longer viable. That is not recovery; it is exhaustion arriving.
The spatial pattern also has an economic topology. Counties where the water table still allows irrigation have maintained property values, crop revenues, and population. Counties where it has not — where the pivot irrigators have shifted to dryland wheat or fallowed the fields — show the downstream effects: smaller tax bases, reduced demand for inputs, and the compounding difficulty of sustaining rural infrastructure on a contracting agricultural economy. The World Resources Institute's Aqueduct tool maps groundwater stress at high resolution and places the southern High Plains among the most severely stressed groundwater systems on the planet, measured as the ratio of withdrawal to available recharge.
Counties where the water table still allows irrigation have maintained property values, crop revenues, and population.
The asymmetry across the map also complicates any uniform policy response. A groundwater management district in central Kansas faces different arithmetic from one in Nebraska: the Kansas district is managing toward a decline it cannot stop, choosing only the rate; the Nebraska district has more room to consider whether a balance between extraction and recharge is achievable. Those are not the same problem, and treating the aquifer as a single unit for policy purposes misses that fact.
What remains firm, county by county, is the tape measurement in the monitoring well. The Kansas Geological Survey drops that tape every January; the number it returns is not a projection or a model output — it is the distance from the surface to the water. That distance has been growing in the southern counties for most of the record. Where it stops growing will depend on what happens above ground, not below it: on how much water farmers in each county choose to pump in each season, against a reserve that recharges, in the south, at a rate geologists describe as negligible.